A metric for leadership
Operational Health Index: one score for each hotel and for the chain
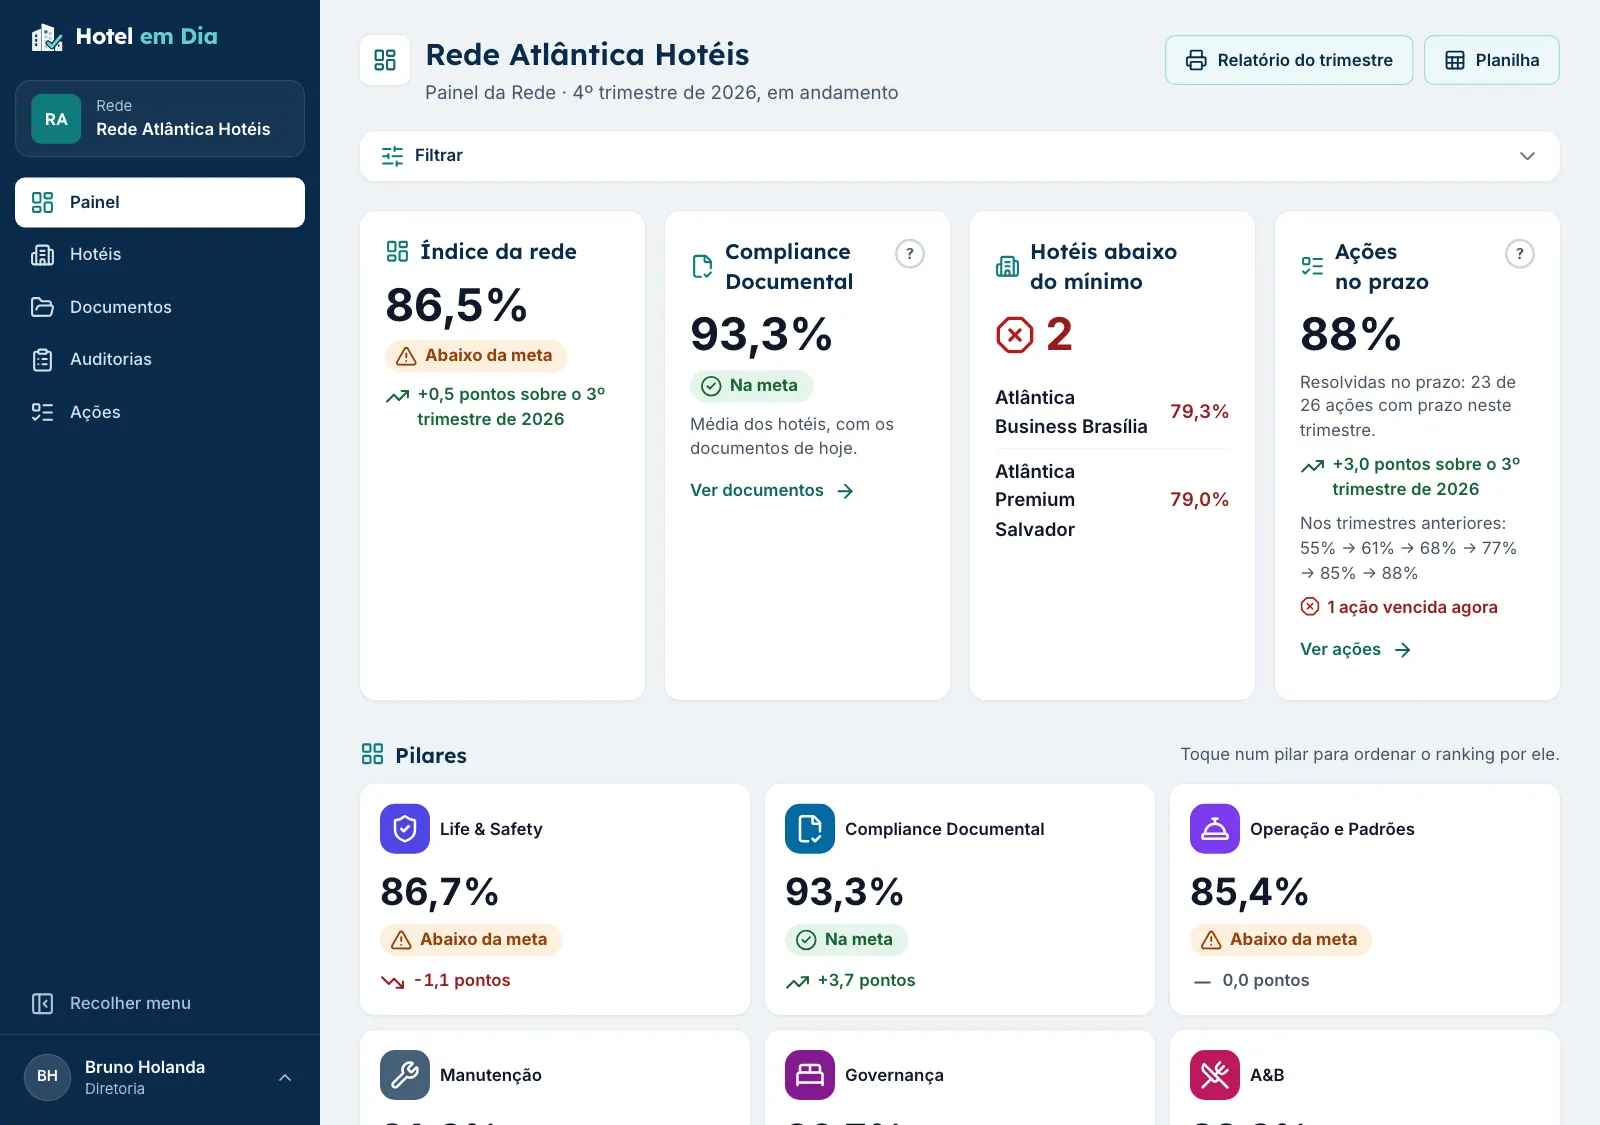
The Operational Health Index is a number from 0 to 100% that sums up each hotel's situation: documents up to date and audit results, with a weight for each pillar. The chain's Index is the average of its hotels, with the history of every quarter.
- No credit card required
- All hotels and users during the trial
- Works on desktop and mobile
The calculation
How is the Operational Health Index calculated?
Each hotel has a score per pillar. The Index is the average of those scores, each with its own weight. The weights below are the defaults; the chain can change them, and they always add up to 100%.
| Pillar | Default weight | Where the score comes from |
|---|---|---|
| Life & Safety | 25% | The score of the latest Life & Safety audit in the period. |
| Document Compliance | 20% | The percentage of documents up to date, valid or expiring soon, on the last day of the quarter. |
| Operations & Standards | 20% | The score of the latest Operations & Standards audit in the period. |
| Maintenance | 15% | The score of the latest Maintenance audit in the period. |
| Housekeeping | 10% | The score of the latest Housekeeping audit in the period. |
| F&B | 10% | The score of the latest F&B audit in the period. |
Documents count twice
Audit items tied to documents, such as the fire certificate, count in the documents pillar and in the audit pillar. This is on purpose: it is the most serious risk.
A pillar without a score stays visible
If a pillar has no score, the Index uses the others, and the dashboard flags it as partial. No one mistakes a partial Index for a complete one.
Minimum and target thresholds
The default is an 80% minimum and a 90% target, which the chain can change. The color of the Index follows the threshold, always with an icon and a word.
Example
What does a hotel's Index look like in practice?
A hotel with the scores shown here, using the default weights. Each score is multiplied by the pillar weight, and the sum divided by 100 gives the hotel's Index for the quarter.
| Pillar | Score | Weight | Points |
|---|---|---|---|
| Life & Safety | 90% | 25% | 22.5 |
| Document Compliance | 80% | 20% | 16.0 |
| Operations & Standards | 85% | 20% | 17.0 |
| Maintenance | 70% | 15% | 10.5 |
| Housekeeping | 88% | 10% | 8.8 |
| F&B | 92% | 10% | 9.2 |
| Hotel Index | 84.0% | ||
History
How do you follow the Index over the year?
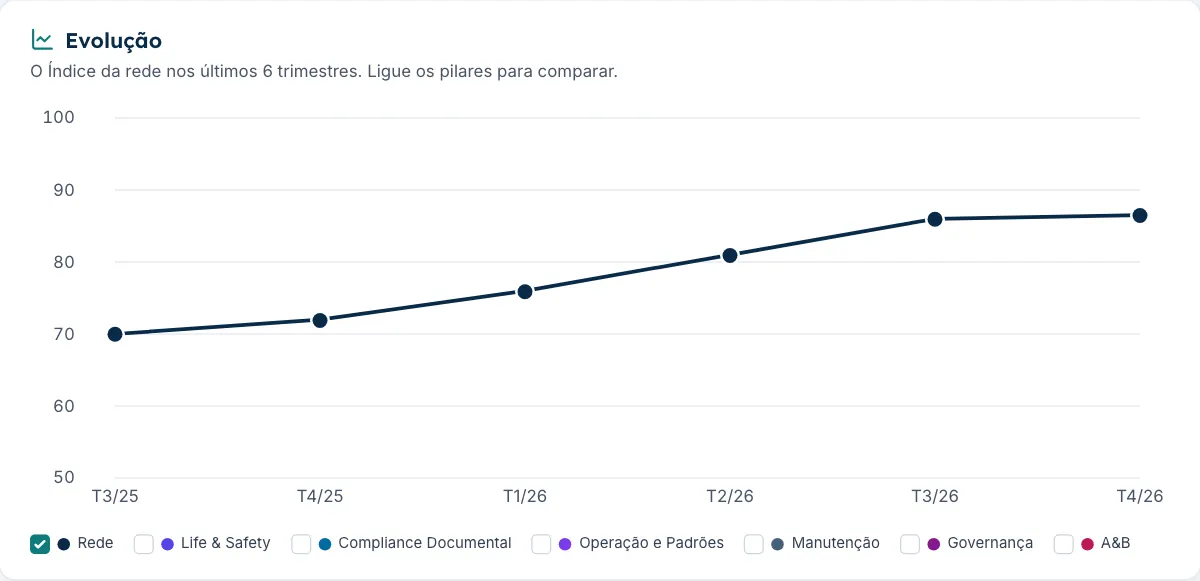
At the end of each quarter, Hotel em Dia saves a snapshot of each hotel's Index, with the pillar scores, the weights and the thresholds of the time. Changing the weights later does not rewrite the past.
-
Q1 Below minimum72%
-
Q2 Below minimum76%
-
Q3 Below target81%
-
Q4 Below target86%
72% → 76% → 81% → 86%: the hotel moved out of the below-minimum band and is 4 points from the 90% target.
What's new
What happens when a critical item fails?
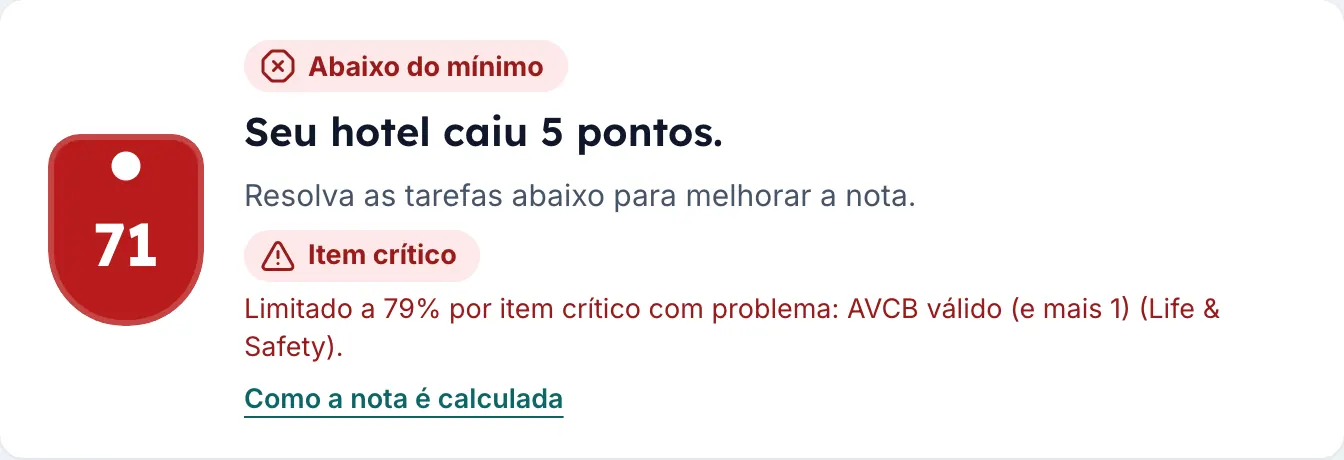
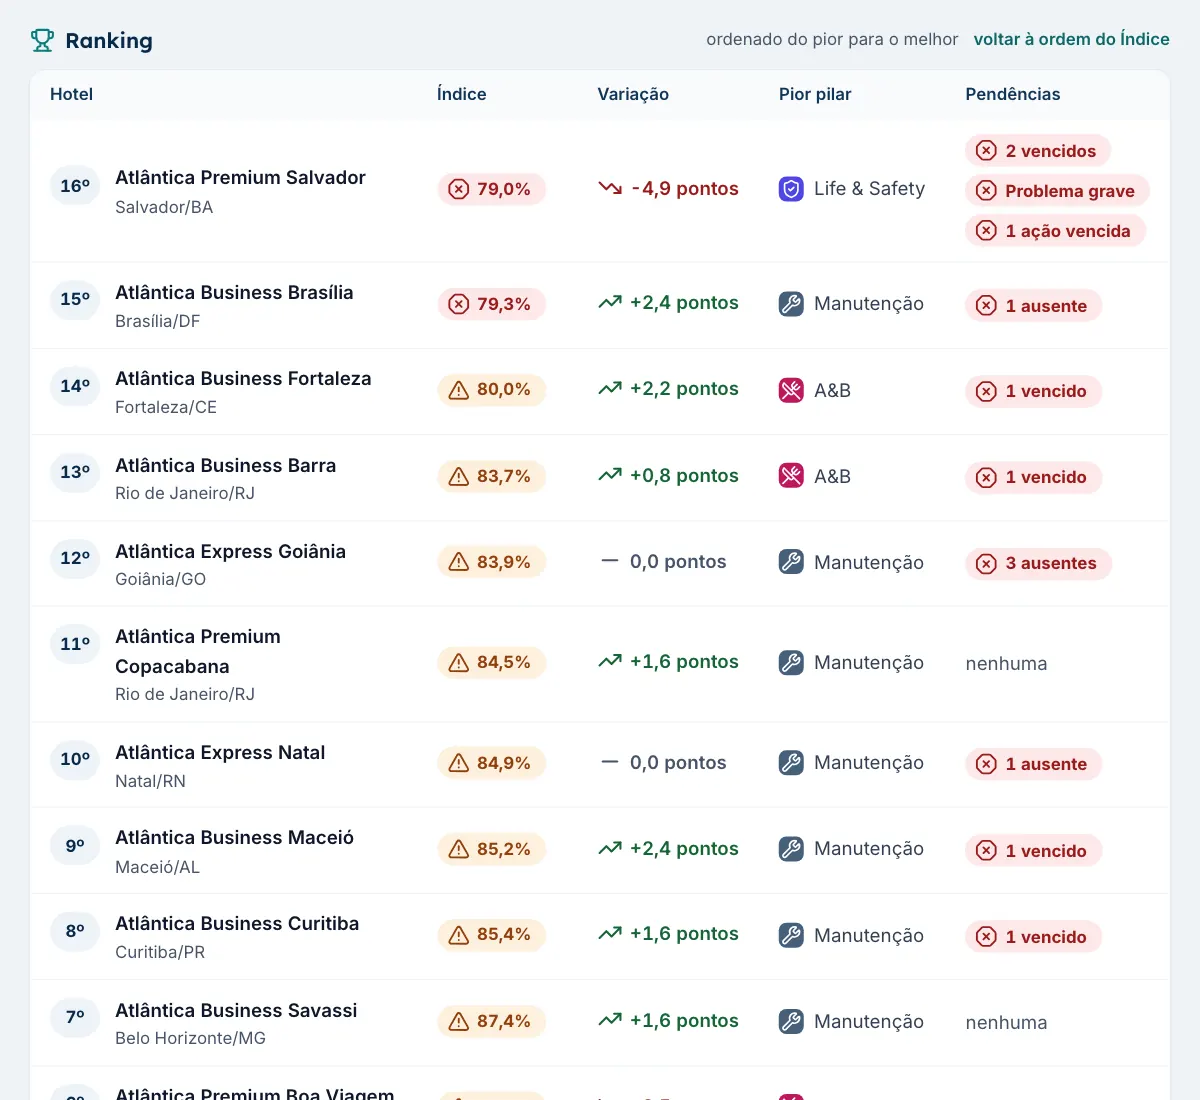
A blocked emergency exit or an expired fire certificate cannot hide behind a high average. With a critical item in trouble, the audit score and the hotel's Index for the quarter are capped at 1 point below the chain's minimum: with an 80% minimum, at most 79%.
- The dashboard shows the Critical item label and the reason for the cap.
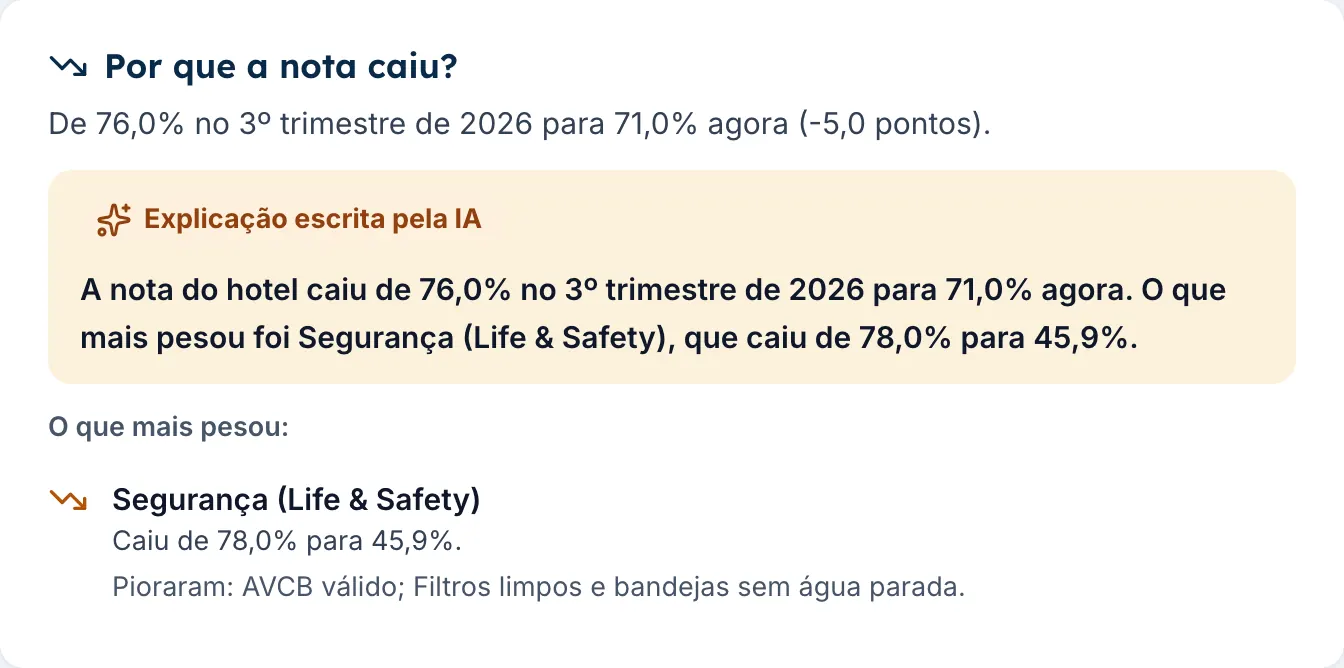
- On the Hotel Dashboard, the hotel manager sees why the score dropped, with the explanation written by the AI.
- The chain can switch the rule off. Closed quarters do not change.
For the board
Why does leadership need a single index?
With one number per hotel, the meeting stops debating spreadsheets and starts discussing where to act.
- Compares what was hard to compare: hotels of different brands, sizes and operating models.
- Shows where to act: the ranking brings each hotel's weakest pillar and open items, such as expired documents and overdue actions.
- No BI project: the Index, the ranking, the trend and the hotel-by-pillar map come ready on the dashboard.
- Ready for the meeting: a quarterly report to print or save as PDF, and an Excel spreadsheet with each hotel's numbers.
- Summary written by AI: a paragraph about the quarter, built from the dashboard numbers, to review and take to the board.
- Ask Hotel em Dia: "which hotels are below the minimum?", and the answer shows where each number came from.
The Index comes from two places: document expiry tracking and the audit checklist by pillar. See also AI for hotels.
FAQ
Frequently asked questions about the Operational Health Index
What is the Operational Health Index?
It is a number from 0 to 100% that sums up each hotel's situation: documents up to date and audit results, with a weight for each pillar. The chain's Index is the average of its hotels.
Can the pillar weights change?
Yes. The chain administrator sets the weight of each pillar, and they always add up to 100%. New weights apply from then on; closed quarters keep the weights used at the time.
How often is the Index updated?
The current quarter's Index changes as documents and audits change. At the end of the quarter, it becomes a fixed snapshot for the history.
What if a pillar has not been audited yet this quarter?
The score from the previous cycle's audit applies, showing where it came from. With no score at all, the Index is calculated with the other pillars, and the dashboard flags it as partial, for example 5 of 6 pillars.
Do I need a BI tool?
No. The chain dashboard already shows the Index, the trend, the ranking and the map of each hotel by pillar. For the board, the quarterly report is ready to print or save as PDF, and the numbers go into an Excel spreadsheet.
How is the chain's Index calculated?
It is the average of the hotels' Indexes. That way, each hotel counts equally, and a hotel with problems shows up in the chain's number.
Does the AI write the quarterly summary for the board?
Yes, when the chain uses this feature. On the Chain Dashboard and in the quarterly report, the AI writes a paragraph in plain words from the chain's aggregated numbers, without names of people or hotels. The text carries an AI-generated label, so you review it before sending.
Does the hotel manager know why the hotel's score dropped?
Yes. The Hotel Dashboard compares with the previous quarter and shows what weighed most in the drop. Hotel em Dia does the math; the AI only writes the explanation in plain words, and without AI the list of reasons still appears.
Does a critical item with a problem weigh more?
Yes. If an audit in the quarter has a critical item with a problem, such as a blocked emergency exit or an expired fire certificate, its score and the hotel's Index for the quarter are capped at 1 point below the minimum: with an 80% minimum, at most 79%. The dashboard shows the reason, and the chain can switch this rule off.
The number leadership will ask for at every meeting.
Create your chain's account, add your first hotel today and watch the dashboard come together. Or book a demo with us.
- No credit card required
- All hotels and users during the trial
- Works on desktop and mobile